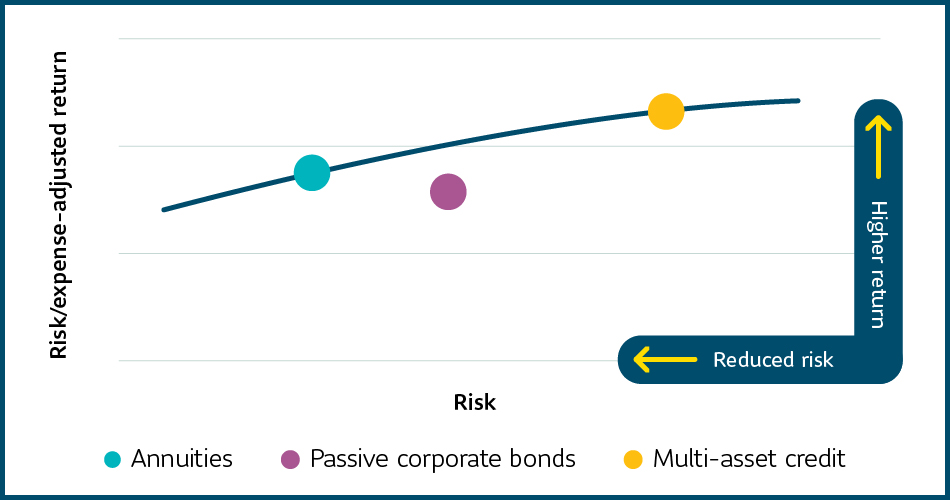
Are annuities on your efficient frontier?

According to the Canadian Institute of Actuaries (CIA), the price of annuities1 relative to corporate bonds has improved by about 5% over the last three and a half years. This is a very big shift in relative value. In fact, the yield on annuities is now better than the yield on a passive corporate bond portfolio after adjusting for risk and expenses (as shown in Table 1).
This improvement in group annuity pricing relative to passive bonds hasn’t gone unnoticed by Canadian defined benefit (DB) plan sponsors and their consultants. It has contributed to two recent trends.
First, it has knocked passive bond portfolios off the efficient frontier for many pension plans. Why would a plan sponsor invest in passive bonds when they can earn a better risk/expense adjusted return on an annuity? Plan sponsors are rethinking their fixed income investment strategies and considering more sophisticated options. For example, multi-asset credit solutions aim to invest opportunistically across a variety of both public and private, investment and non-investment grade, fixed income securities to provide diversified benefits, improved yields and ease of access to investors. These sorts of solutions add value compared to a passive bond portfolio and better compete with annuities.
Second, it’s improved the funded status of many pension plans – in many cases resulting in funded ratios above 100%. This makes purchasing annuities more affordable for pension plans and has led to more annuity purchases. According to LIMRA, the group annuity market doubled over the last four years – from $3.7 billion in 2017 to $7.7 billion in 2021. About 88% of annuity purchases in 2021 were for ongoing pension plans2. This highlights how annuities are being used by plan sponsors as a proactive risk management tool.
The efficient frontier of investment solutions
*For illustration purposes only
It’s unclear how long this phenomenon will last. It could be the result of temporary supply and demand imbalances, or it could be the result of long-term market changes.
What’s clear is that dynamic plan sponsors have an opportunity to “trade up”. Plan sponsors with passive bond portfolios can consider redeploying these bonds into more sophisticated investment solutions and/or using them to purchase annuities. There are a lot of elements to consider so it’s best to engage your consultant or investment manager for advice.
Email our team of experts to discuss de-risking solutions for your DB pension plan.
1 In this article, annuities refer to non-CPI-linked annuities.
2 Willis Towers Watson Group Annuity Market Pulse, 2021 Annual Review.
How we changed oranges to apples
Plan sponsors interested in reducing their pension plan risk have two main options:
- They can transfer risk through an annuity purchase, or
- They can retain risk but reduce it by better matching their assets and liabilities.
How are plan sponsors comparing these two options? One approach that’s gaining popularity is to think of annuities as a type of bond. This logic is obvious for buy-in annuities (which are considered by regulators as a pension plan investment) but can also be applied to buy-out annuities. In fact, many consultants are modelling annuities as an asset class when they prepare asset liability studies.
As can be seen from Graph 1, historically the yield on annuities was very close to the yield on a passive provincial bond portfolio. In early 2019 this started to shift and now the yield on annuities is very close to the yield on a passive corporate bond portfolio. This relative improvement of about 0.50% in yield translates into a 5% improvement in price.
Graph 1 - Evolution of the Annuity Proxy Yield
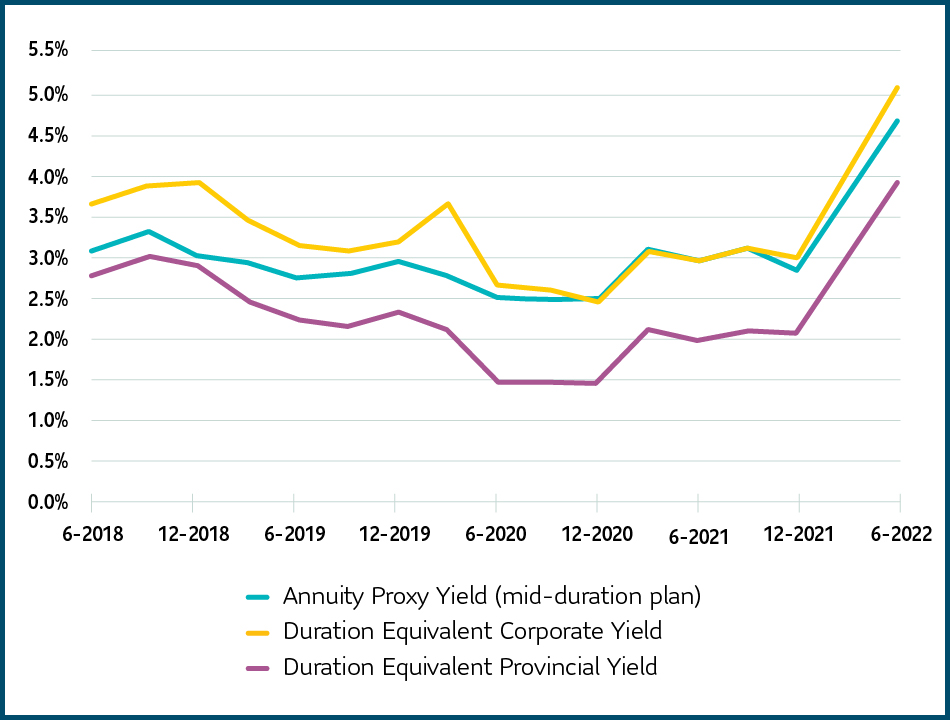
Source: Sun Life, June 30, 2022.
Notes: The Annuity Proxy Yield (mid-duration plan) is calculated using the medium duration annuity proxy spread, published by the CIA, and CANSIM V39062 yields at various effective dates.
Duration Equivalent Corporate and Provincial Yields are based on a blend of the All and Long Term FTSE Canada corporate and provincial bond indices to achieve the same duration as the CIA medium duration annuity proxy at various dates.
But that’s not the end of the story. Annuities transfer investment and longevity risk to the insurer. They also include future investment expenses and annuity buy-outs include future administration expenses. To make an apples-to-apples comparison, it’s necessary to adjust for these factors.
The easiest way to make an adjustment is to reduce the yield on the bond portfolio. This makes sense as the bond portfolio is still exposed to risk and expenses and therefore its yield is inflated compared to the annuity yield.
The amount of the adjustment will differ depending on each pension plan’s characteristics. A typical adjustment could be about 1.00%, but it could be higher or lower. A large portion of this adjustment is due to longevity risk, but credit risk and future investment and administrative expenses also play a part.
As can be seen from Table 1, at August 31, 2022, the yield on an annuity was 4.6%3 and the adjusted yield on a passive corporate bond portfolio was 4.0%. Hence the yield on annuities is better than the yield on a passive corporate bond portfolio after adjusting for risk and expenses.
Table 1 - Comparing yields on annuities and passive corporate bonds at August 31, 2022
3 Using the June 30, 2022, medium duration annuity proxy spread, published by the CIA, and CANSIM V39062 yields at August 31, 2022.
4 Based on a blend of the All and Long Term Corporate Bond indices at August 31, 2022 to achieve the same duration as the June 30, 2022 CIA medium duration proxy.
5 Sun Life estimates as of August 31, 2022.