
Industry Watch 2022
February 28, 2023

Over 85 transacted in 2022, including 15 repeat buyers.
Since 2013 45+ plan sponsors have come to market at least 2x and 20+ have come atleast 3x.
Over 38K Canadians had part or all of their pension insured in 2022. 165k+ insured since 2017. Innovation enables insurers to protect more plan members.
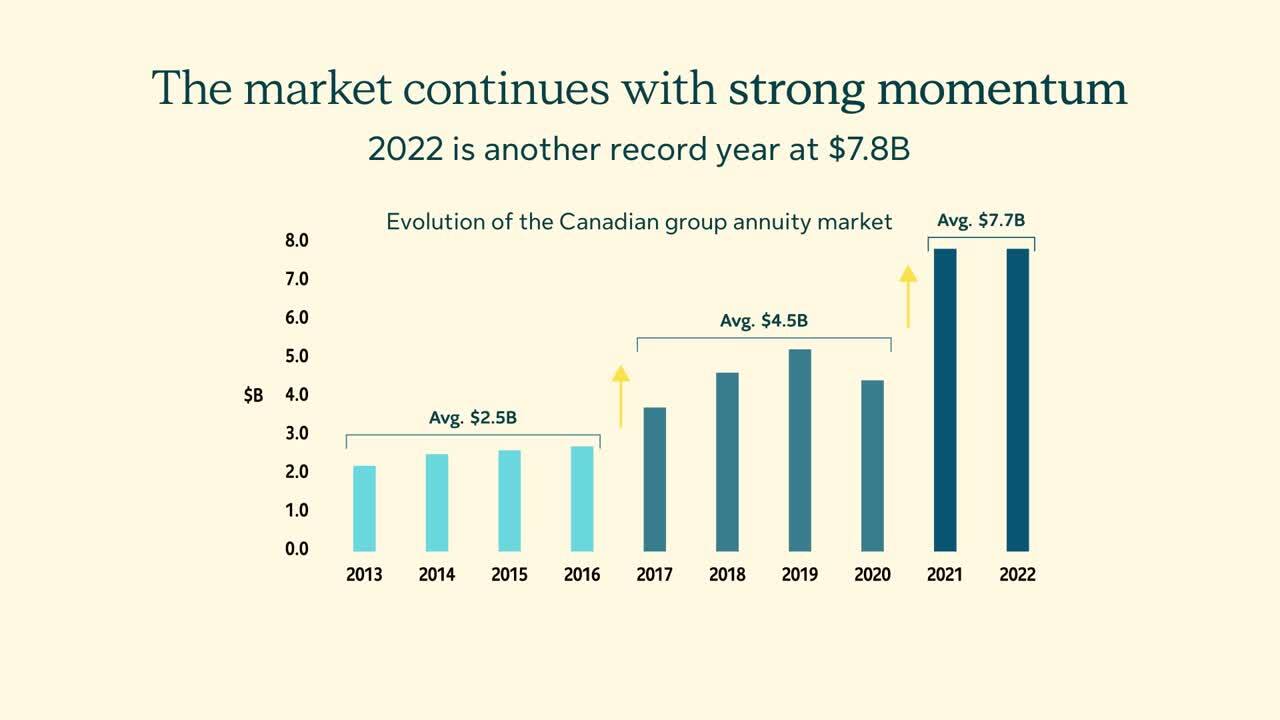
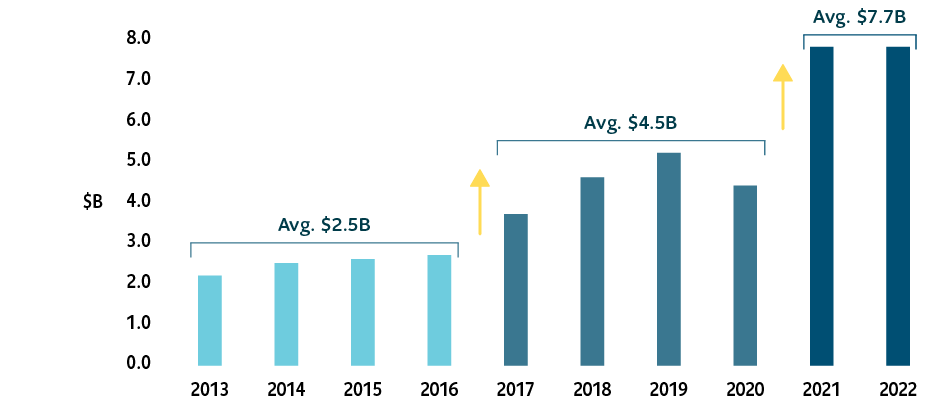
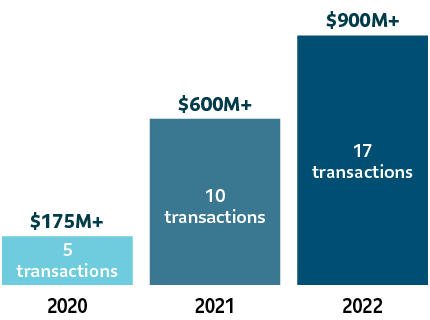
2022 is another record year at $7.8B
The market hit another growth marker in the last two years
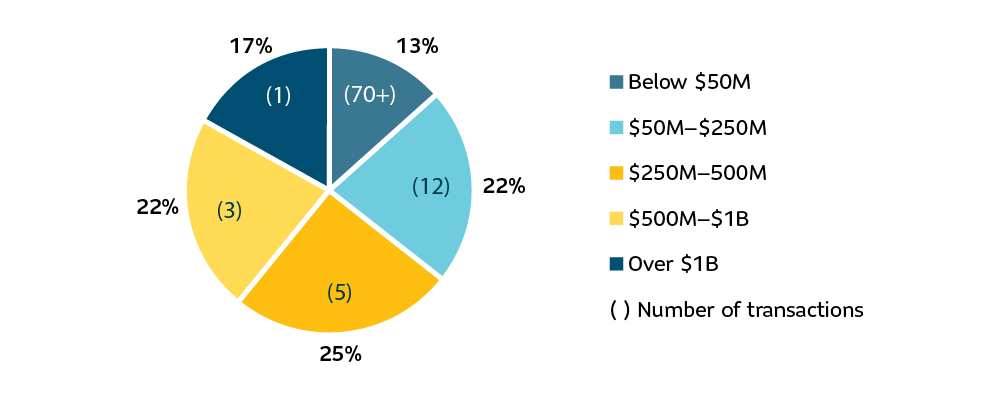
2022 annuity premiums by transaction size
Planning for a successful transaction is essential, with the market completing almost two transactions per week in 2022!
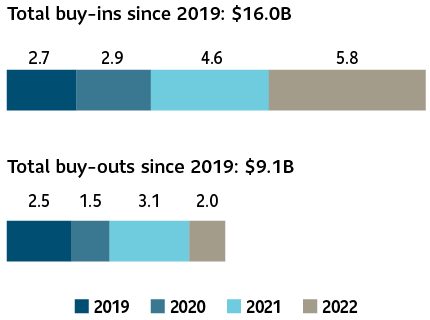
Interesting trend as strong funded statuses could have led to more buy-outs
Over $3.7B inflation-linked liabilities insured since 2013
The cost of inflation protection can be illustrated as the difference in yield between Canadian nominal return bonds and Canadian real return bonds.
The cost of inflation protection is hovering around the 2% mark. With 2022 year-over-year inflation at 6.3% in Canada, there is an opportunity to transfer inflation risk.
The Government of Canada’s announcement to cease the issuance of real return bonds will impact DB plan sponsors with inflation-linked liabilities. To find out how, read the Canadian Institute of Actuaries (CIA) statement.
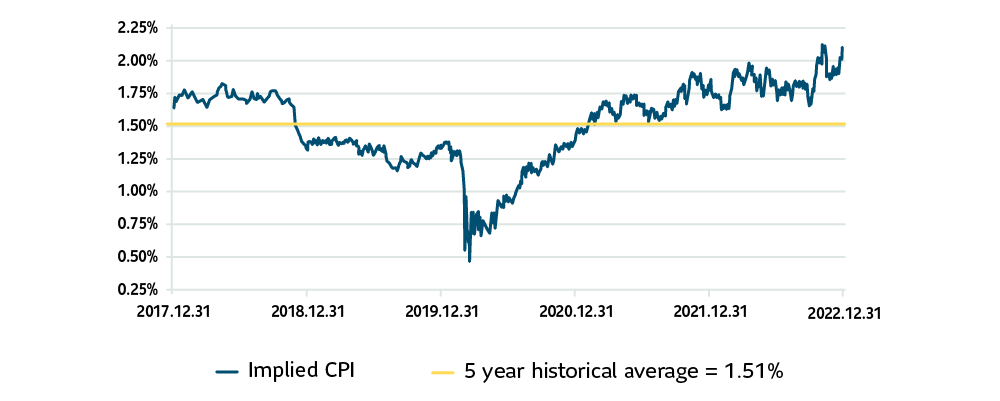
1Calculated using [(1+CANSIM V39062) / (1+ CANSIM V39057) – 1] for each year. As of December 31, 2022.
Price of group annuities relative to provincial bonds has improved by about 6% since early 2019 – a big shift in relative value.
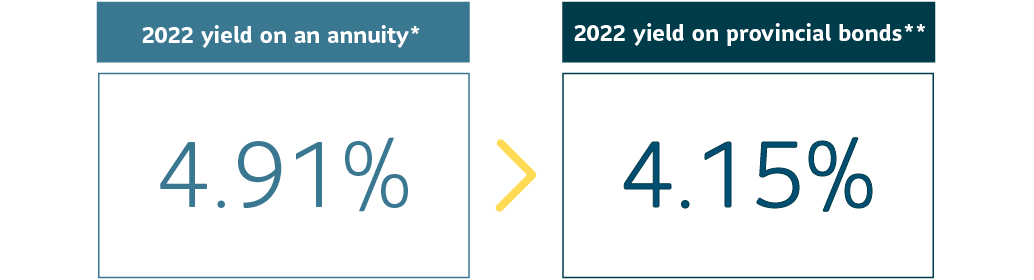
* Using the December 31, 2022, medium duration annuity proxy spread, published by the CIA, and CANSIM V39062 yields at December 31, 2022.
** Duration Equivalent Provincial Yields are based on a blend of the All and Long Term FTSE Canada provincial bond indices to achieve the same duration as the CIA medium duration annuity proxy at December 31, 2022.
The CIA guidance has resulted in annuity yields that were often similar to corporate bond yields. In addition, “…most of our transactions during the third quarter have resulted in premiums below the estimates determined using the CIA guidance.” – WTW Group Annuity Market Pulse – Third Quarter 2022
Evolution of the Annuity Proxy Yield
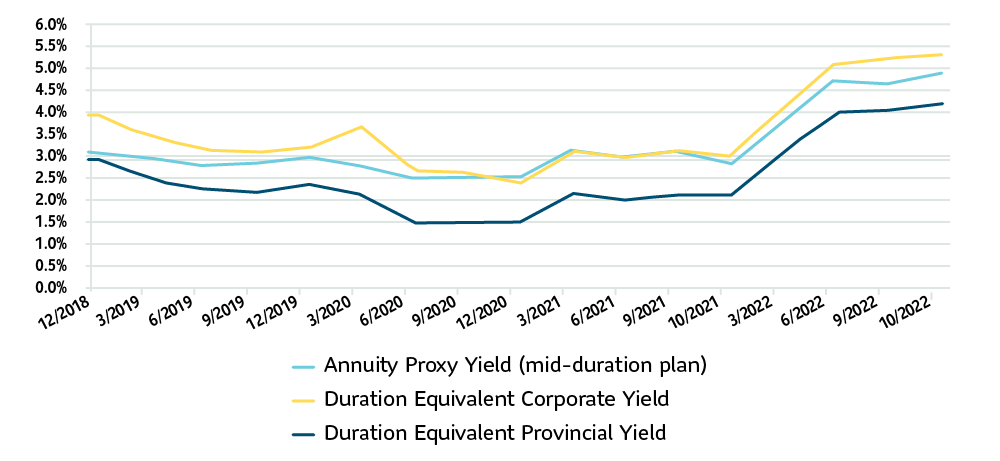
Source: Sun Life, December 31, 2022.
Notes: The Annuity Proxy Yield (mid-duration plan) is calculated using the medium duration annuity proxy spread, published by the CIA, and CANSIM V39062 yields at various effective dates.
Duration Equivalent Corporate and Provincial Yields are based on a blend of the All and Long Term FTSE Canada corporate and provincial bond indices to achieve the same duration as the CIA medium duration annuity proxy at various dates.
For a detailed comparison between annuity yield and passive bond yield, read this recent article from Brent Simmons: Are annuities on your efficient frontier?
DB Solutions is excited to celebrate 15 years in the Canadian group annuity market.
We’re proud to have the largest market share for the 15th year in a row.1
We made more than $1.1B in annual pension payments to over 120K Canadians.2
Group annuities provided by Sun Life Assurance Company of Canada, a member of the Sun Life group of companies. Results and information in this infographic are based on Sun Life estimates unless otherwise noted.
Sources & notes:
1 The Secure Retirement Institute Canadian Pension Market report published by LIMRA, February 8, 2023.
2 Includes only buy-in, buy-out and longevity insurance contracts.
Subscribe to the DB Solutions Insights email for the latest insights on managing DB pension risk.
We partner with plan sponsors to provide innovative, customized solutions that reduce DB plan risk.